MPSlib: Training images in scikit-mps
scikit-mps contains a module, mpslib.trainingimages, that allows loading and creating a number of training images.
[8]:
import numpy as np
import matplotlib.pyplot as plt
import mpslib as mps
import pyvista
#pyvista.set_plot_theme("document")
#pyvista.global_theme.jupyter_backend = 'panel'      # use this in Jupyter Lab
#pyvista.global_theme.jupyter_backend = 'pythreejs'  # use this in Jupyter Notebook
List available training images
[9]:
TI_type, TI_desc = mps.trainingimages.ti_list()
Available training images:
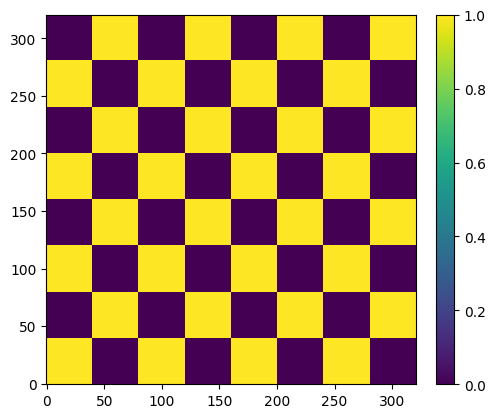
checkerboard - 2D checkerboard
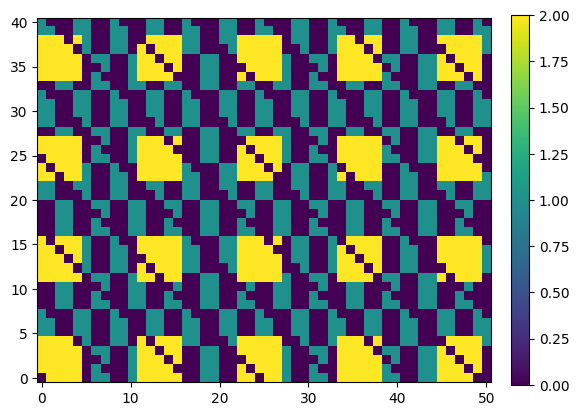
checkerboard2 - 2D checkerboard - alternative
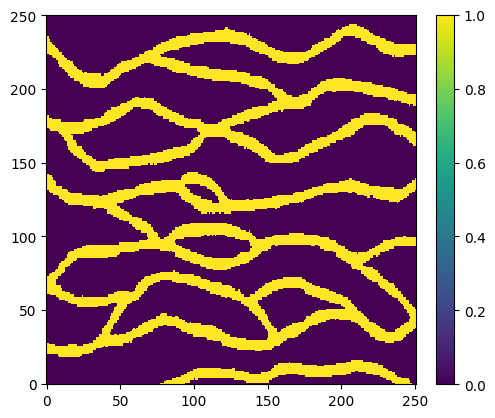
strebelle - 2D discrete channels from Strebelle
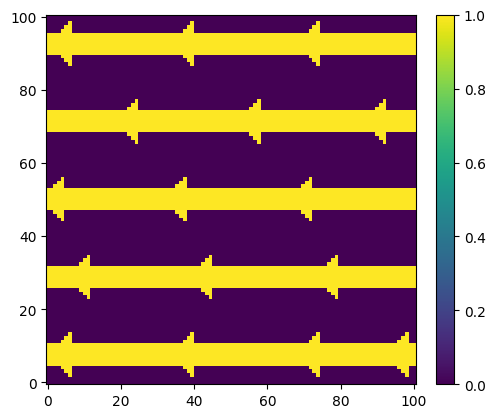
lines - 2D discrete lines
stones - 2D continious stones
bangladesh - 2D discrete Bangladesh
maze - 2D discrete maze
rot90 - 3D rotation 90
horizons - 3D continious horizons
fluvsim - 3D discrete fluvsim
Plot training images
Load and plot a single training image
[10]:
TI, TI_filename = mps.trainingimages.strebelle()
TI.shape
mps.plot.plot_2d(TI, header='Strebelle')
Beginning download of https://github.com/GAIA-UNIL/trainingimages/raw/master/MPS_book_data/Part2/ti_strebelle.sgems to ti_strebelle.dat
Plot all training images
[11]:
for i in range(len(TI_type)):
    ti_type = TI_type[i]
    print('Loading and plotting %s' % (ti_type))
    O_TI = getattr(mps.trainingimages, ti_type)
    TI, TI_fname = O_TI()
    mps.plot.plot(np.squeeze(TI), slice=0, header=TI_desc[i])
Loading and plotting checkerboard
Loading and plotting checkerboard2
Loading and plotting strebelle

Loading and plotting lines
Beginning download of https://github.com/GAIA-UNIL/trainingimages/raw/master/MPS_book_data/Part2/ti_lines_arrows.sgems to ti_lines.dat
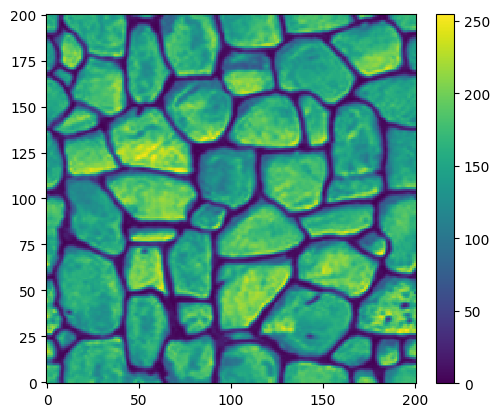
Loading and plotting stones
Beginning download of https://github.com/GAIA-UNIL/trainingimages/raw/master/MPS_book_data/Part2/ti_stonewall.sgems to ti_stones.dat
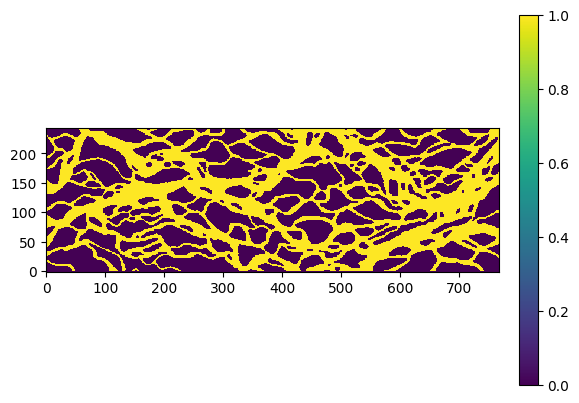
Loading and plotting bangladesh
Beginning download of https://github.com/GAIA-UNIL/trainingimages/raw/master/MPS_book_data/Part2/bangladesh.sgems to ti_bangladesh.dat
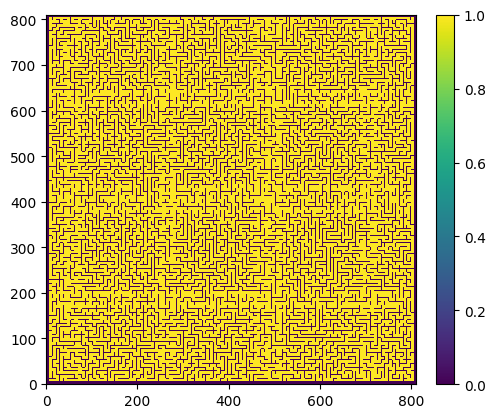
Loading and plotting maze
Beginning download of https://raw.githubusercontent.com/cultpenguin/mGstat/master/ti/maze.gslib to ti_maze.dat
Loading and plotting rot90
Beginning download of https://github.com/GAIA-UNIL/trainingimages/raw/master/MPS_book_data/Part2/checker_rtoinvariant_90.zip to ti_tot90.dat.zip
Unziping ti_tot90.dat.zip to ti_tot90.dat
---------------------------------------------------------------------------
AttributeError                            Traceback (most recent call last)
Cell In[11], line 6
      4 O_TI=getattr(mps.trainingimages,ti_type)
      5 TI, TI_fname=O_TI()
----> 6 mps.plot.plot(np.squeeze(TI), slice=0, header=TI_desc[i])

File /mnt/d/PROGRAMMING/mpslib/scikit-mps/mpslib/plot.py:70, in plot(D, force_3d, slice, threshold, origin, spacing, **kwargs)
     67 cmap = kwargs.get('cmap',"viridis")
     69 if (D.ndim == 3)|(force_3d==1):
---> 70     plot_3d(D, origin=origin, spacing=spacing, **kwargs)
     71 else:
     72     plot_2d(D, origin=origin, spacing=spacing, **kwargs)

File /mnt/d/PROGRAMMING/mpslib/scikit-mps/mpslib/plot.py:142, in plot_3d(Data, origin, spacing, **kwargs)
    140 # create uniform grid
    141 if (plotgrid==1)|(slice==1):
--> 142     grid = numpy_to_pvgrid(Data, origin=origin, spacing=spacing)
    144 if (plotgrid==1)&(slice==0):
    145     plot.add_mesh(grid, cmap=cmap, show_edges=show_edges, opacity=opacity)

File /mnt/d/PROGRAMMING/mpslib/scikit-mps/mpslib/plot.py:42, in numpy_to_pvgrid(Data, origin, spacing)
     36 '''
     37 Convert 3D numpy array to pyvista uniform grid
     38
     39 '''
     41 # Create the spatial reference
---> 42 grid = pyvista.UniformGrid()
     43 # Set the grid dimensions: shape + 1 because we want to inject our values on the CELL data
     44 grid.dimensions = np.array(Data.shape) + 1

File ~/integrate/lib/python3.11/site-packages/pyvista/__init__.py:128, in __getattr__(name)
    126 except AttributeError:
    127     msg = f"module 'pyvista' has no attribute '{name}'"
--> 128     raise AttributeError(msg) from None
    130 return feature

AttributeError: module 'pyvista' has no attribute 'UniformGrid'
Coarsen a 2D training image to a 3D training image
[ ]:
# Load the full Strebelle TI
TI, TI_name = mps.trainingimages.strebelle(di=1)
mps.plot.plot(np.squeeze(TI))

# Load every 4th pixel from Strebelle
TI, TI_name = mps.trainingimages.strebelle(di=4)
mps.plot.plot(np.squeeze(TI))
[ ]:
# Load all possible sub-grid variations of Strebelle using a 4x4 sub-grid
TI, TI_name = mps.trainingimages.strebelle(di=4, coarse3d=1)
mps.plot.plot(np.squeeze(TI))